
Data
Georgia Explorer Map
Welcome to the Georgia Explorer! This interactive map shows Georgia’s Congressional and Legislative districts. Explore by panning or zooming in or go to a specific location or community using the search tool.
We’ve revised the underlying interactive map layers with the latest 2020 U.S. Census demographic data used to draw the adopted district maps. In addition, you can compare the previously enacted district maps and even see maps that were proposed but not adopted by the Georgia General Assembly.
Navigation
Navigate using the drop-down menus and toggle buttons at the top.
Use the menu on the left to select the current legislative or congressional boundaries.
The next menu allows you to select the demographic or partisan lean layer to display as a background.
You can use the Search bar on the right to search for any address or location in Georgia and zoom to that location.
Streets: shows the standard street map as background, with no data overlays. Use this to see where you are in the map.
Percent Black Voting Age Population: shows the proportion of the Voting-Age Population that is identified as any part Black, both Hispanic and non-Hispanic in the 2020 census. It is displayed at the census tract level and changes to the census block level when you zoom in.
Percent Hispanic Voting Age Population: shows the proportion of the Voting-Age Population that is identified as Hispanic in the 2020 census. It is displayed at the census tract level and changes to the census block level when you zoom in.
Percent Minority Voting Age Population: shows the proportion of the Voting-Age Population that is not identified as White-and-non-Hispanic in the 2020 census. It is displayed at the census tract level and changes to the census block level when you zoom in.
Partisan Lean (2018-2020): shows the average percent of Democratic votes across three recent statewide elections using voting precinct level data.* It is displayed at the voting precinct level.The Show city boundaries toggle displays the city boundaries, as provided by the US census designated place spatial dataset.
*2018 Governor, 2020 Presidential, and 2021 Senate run-off (Loeffler/Warnock).
Notes on BVAP and AVAP:
The definition of Black Voting Age Population (BVAP) and Asian Voting Age Population (AVAP) is different than what the Princeton Gerrymandering Project and FDGA used to establish fairness benchmarks to evaluate the 2021 proposed and enacted maps.
When establishing those benchmarks, we defined BVAP as voters who identified as Black alone, both Hispanic and non-Hispanic, and AVAP as voters who identified as Asian alone. This corresponded with the census categories used in studies of voter behavior and election outcomes.
The 2022 enacted maps were drawn using a broader definition of BVAP and AVAP that included all people 18 years or older that identified as either Black or Asian alone or two or more races that included Black or Asian respectively.
We determined that the Georgia Explorer maps should match this standard, especially given the growing diversity of Georgia.
Fairness Benchmarks vs. Enacted Maps
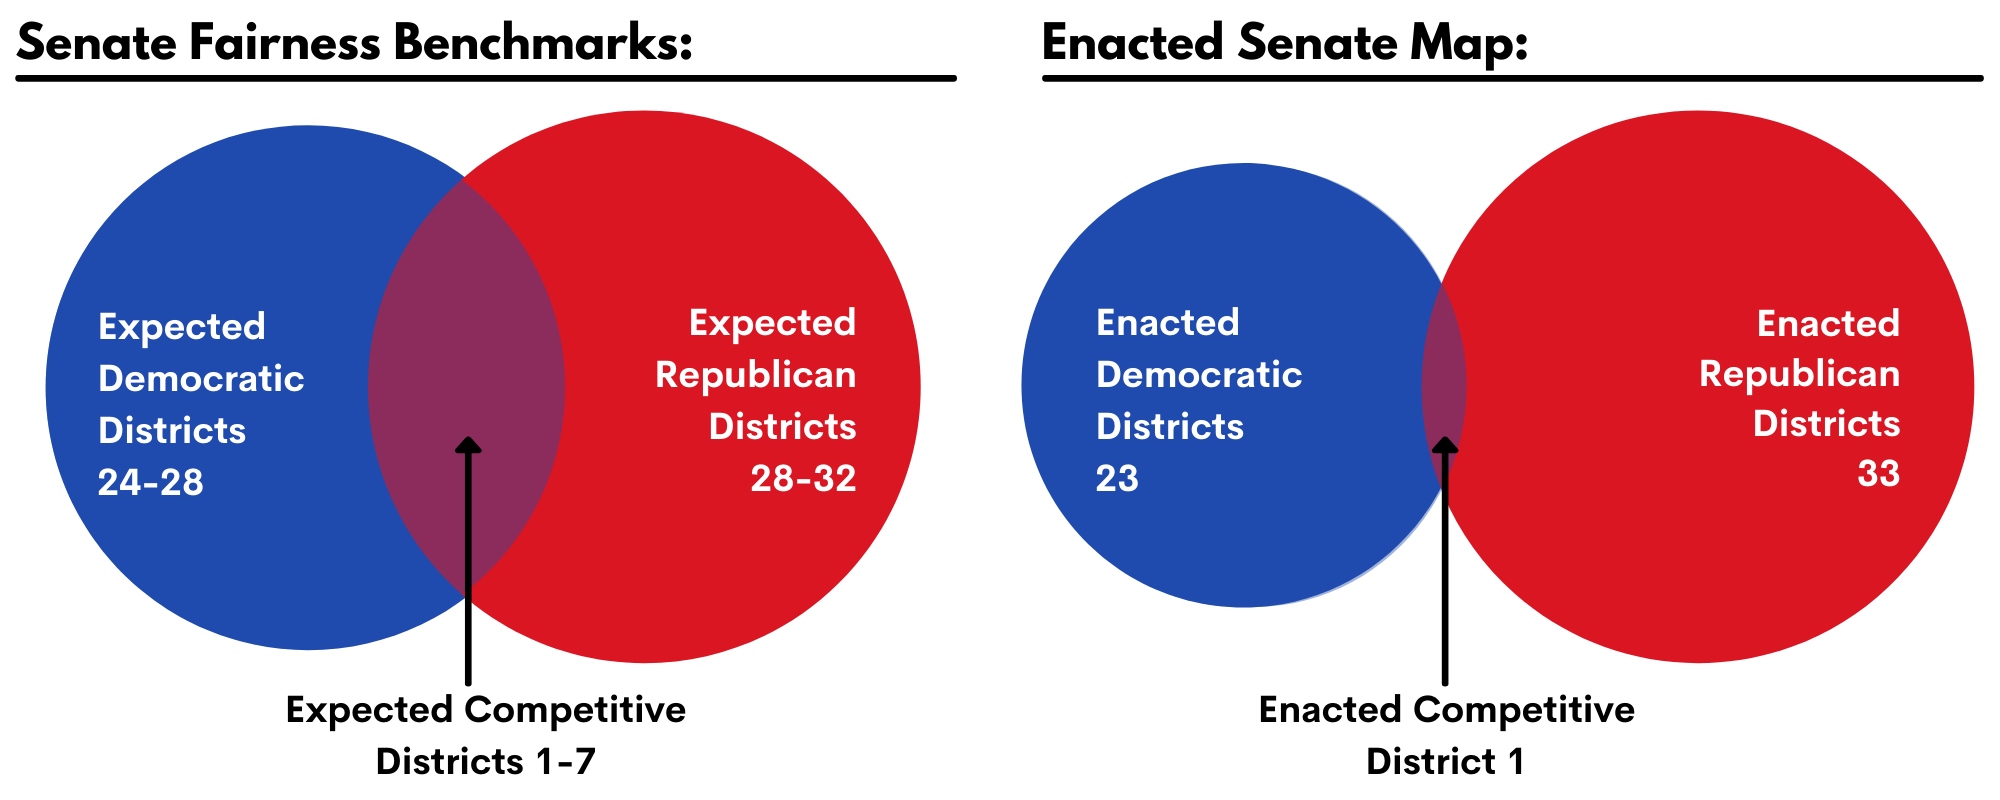
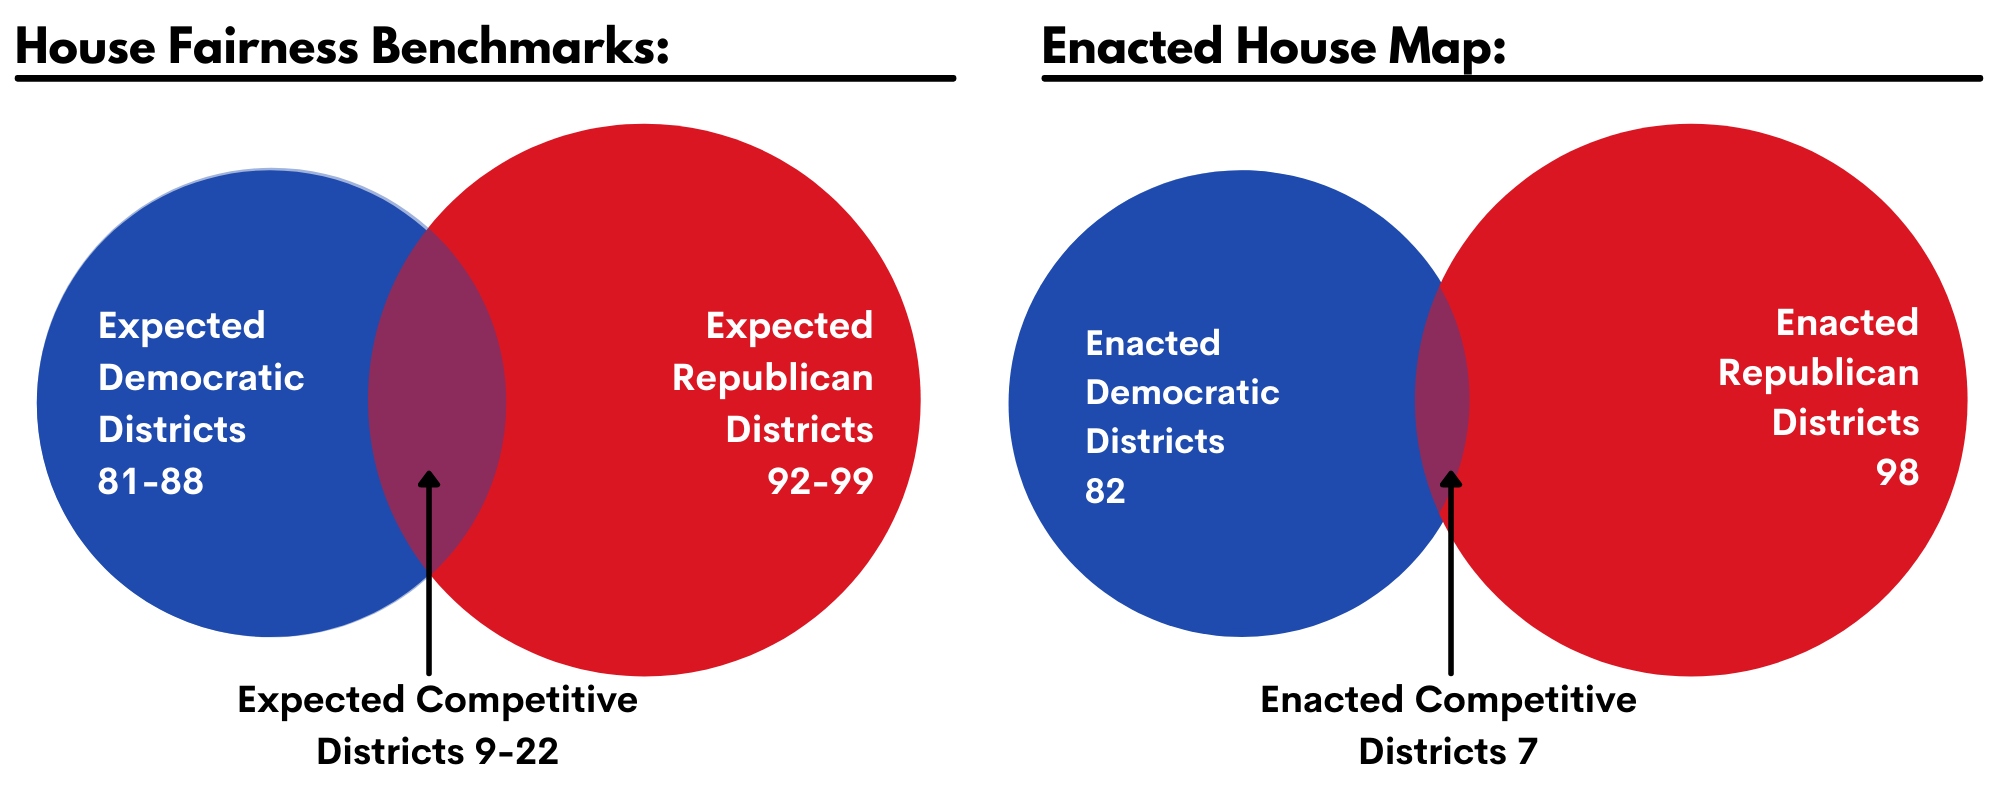
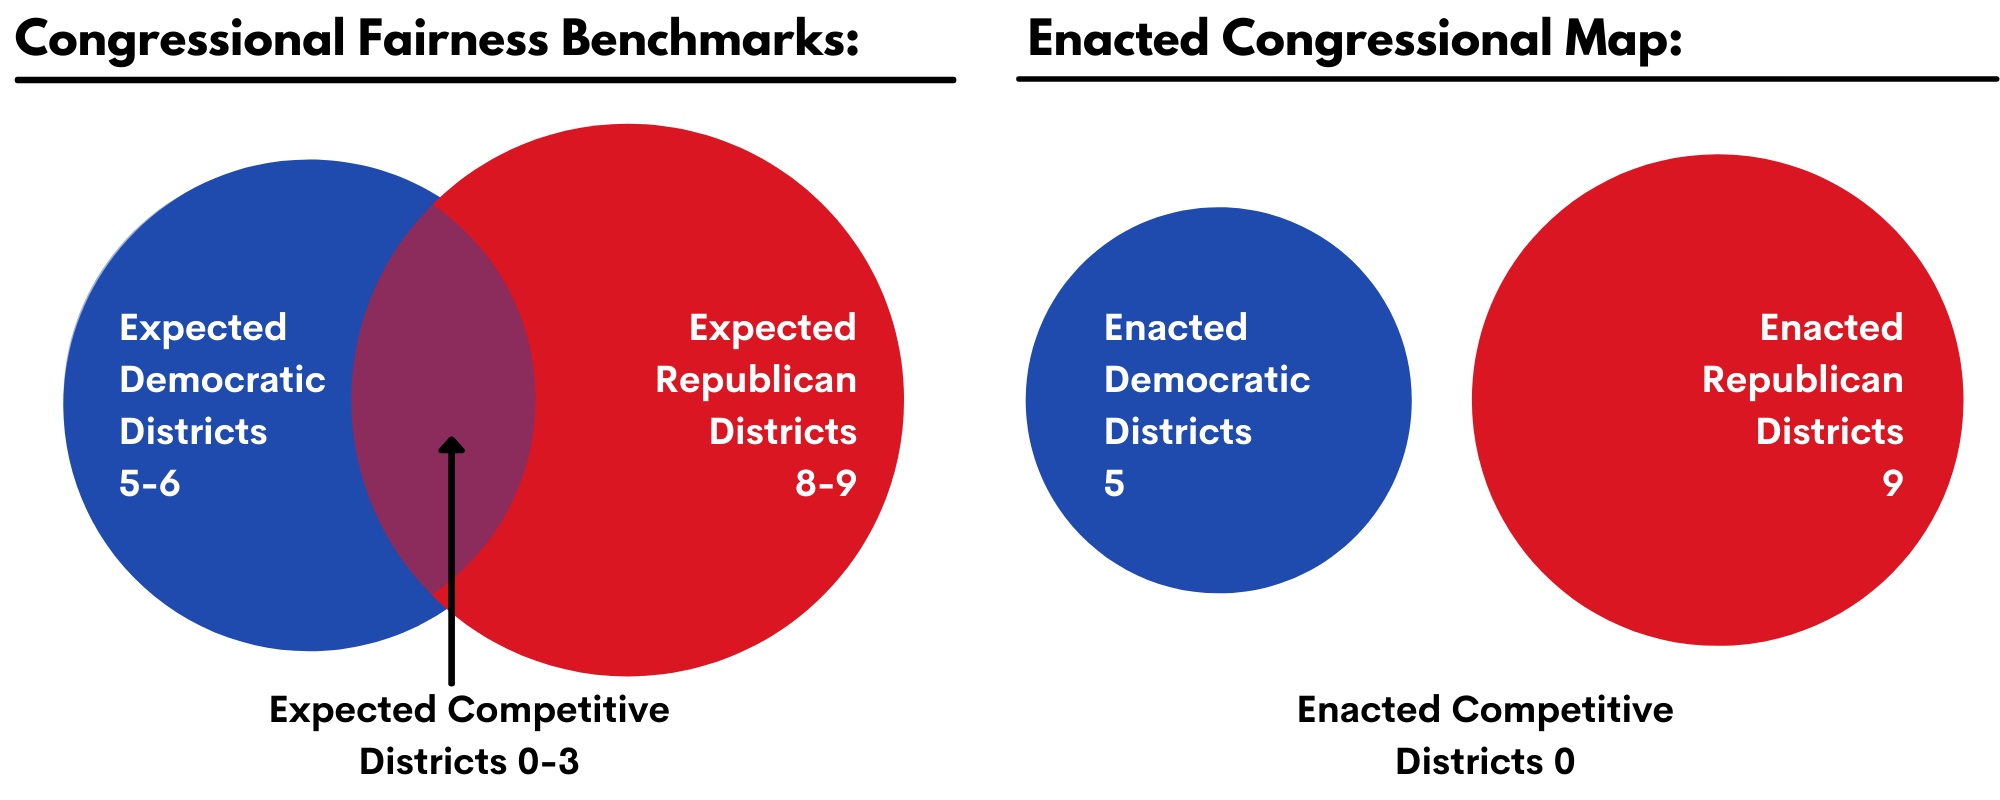
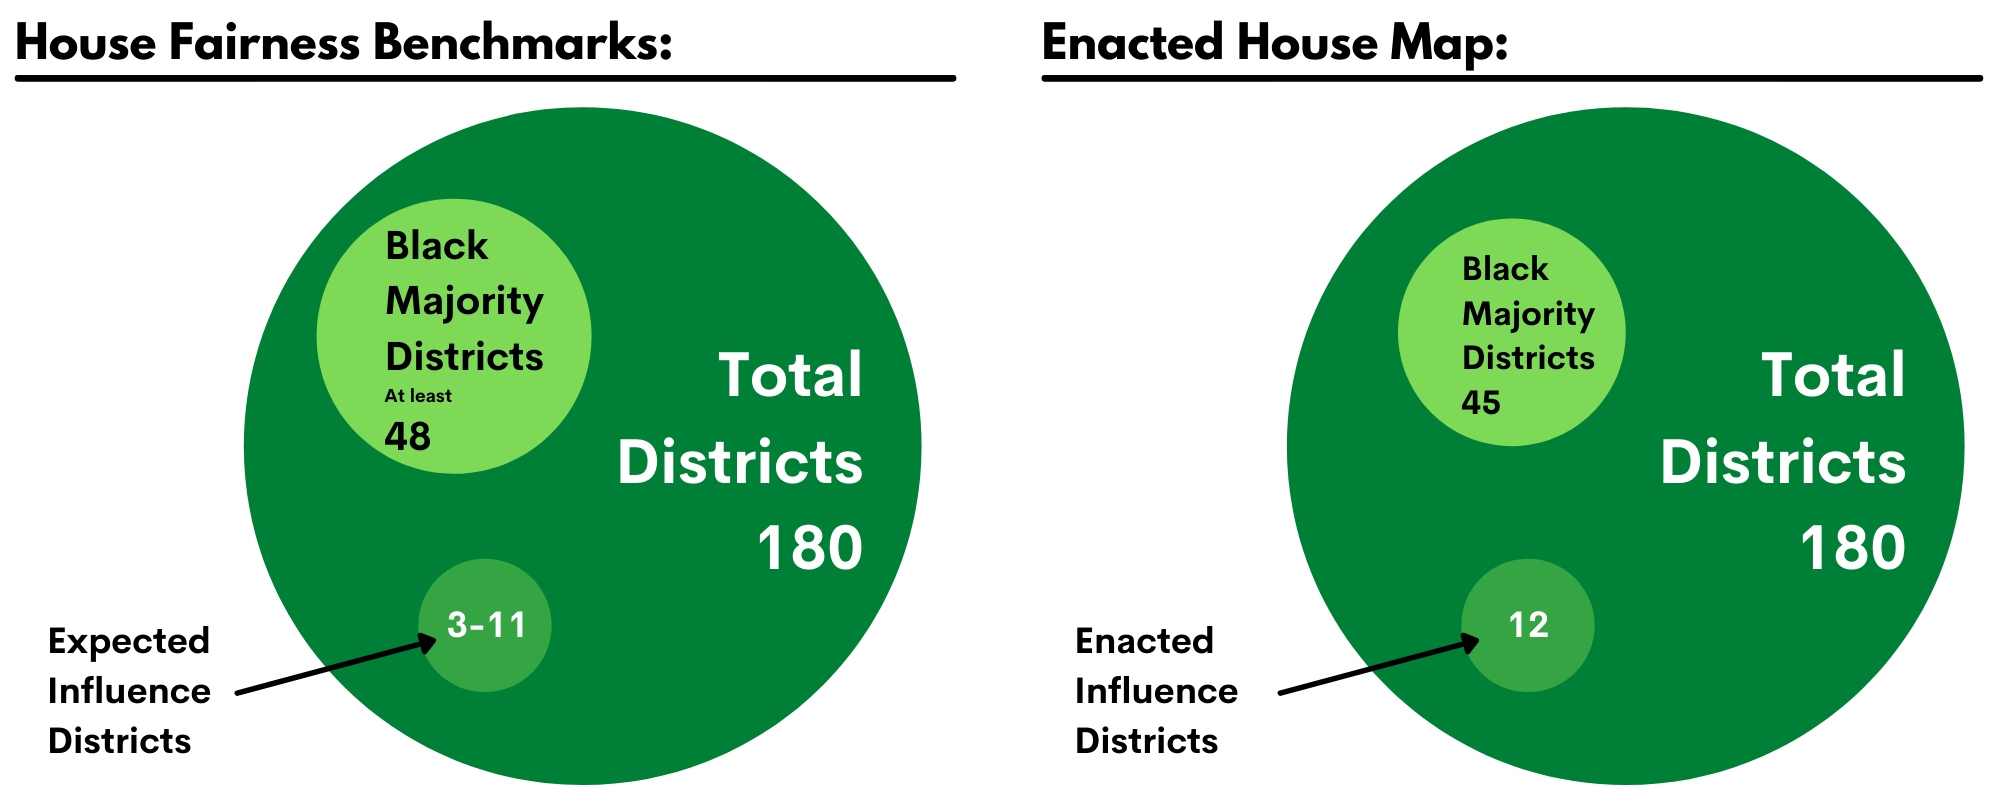
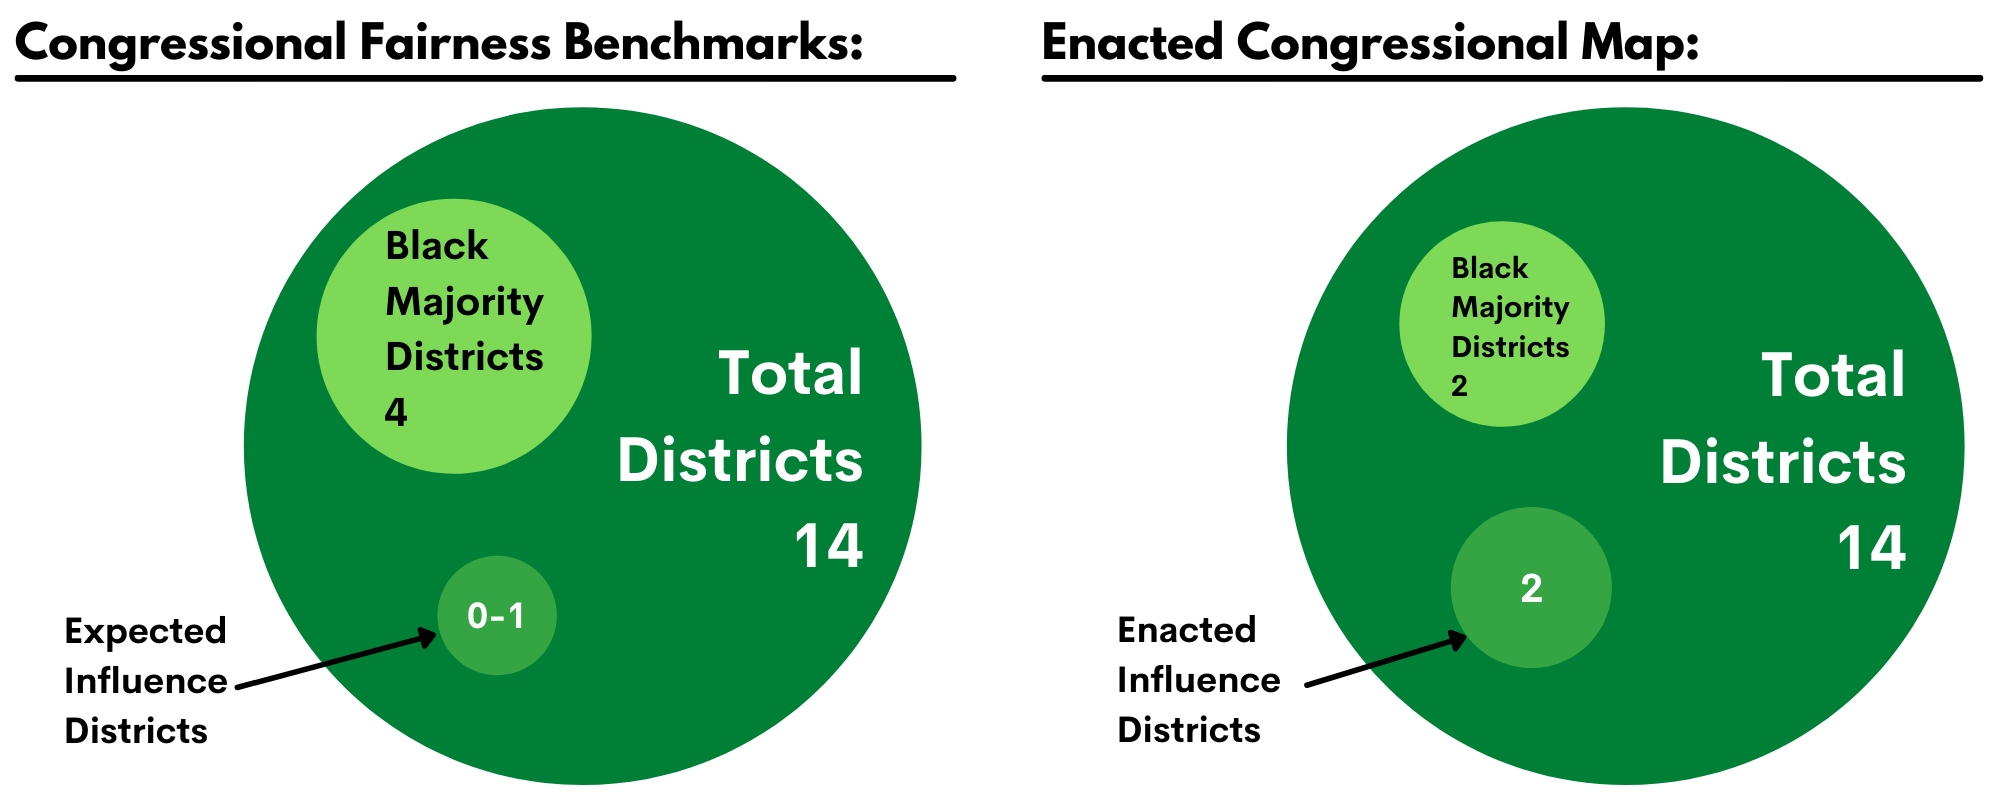
Working with the Princeton Gerrymandering Project, we created over one million simulated maps for each chamber – State House, State Senate, and Congress – using 2020 Census data, which complied with state law and the federal Voting Rights Act, and also incorporated the Georgia Assembly’s redistricting guidelines.
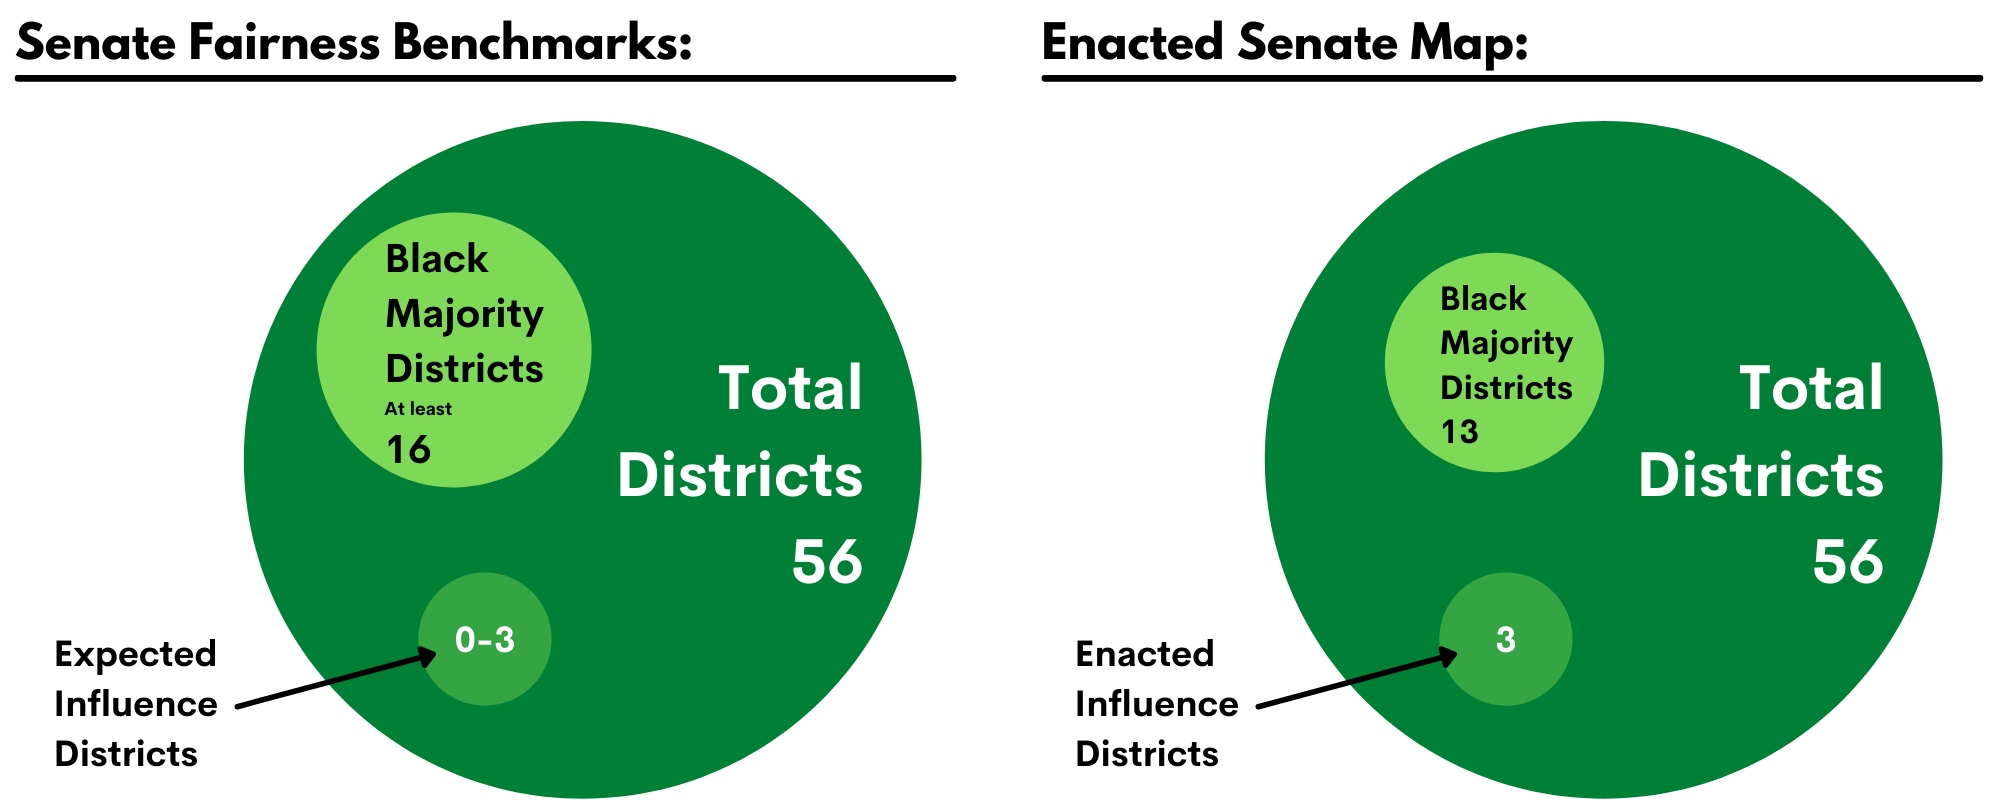
These maps measured partisan lean (using the average of the three most recent statewide elections) and also minority representation (lookng at the demographics of voting-age population and how many districts were considered majority-minority).
Check out the data more deeply in our Redistricting 2021: How to Map a Changing Georgia briefing or, in the graphic images below that show what was expected vs. what was enacted.